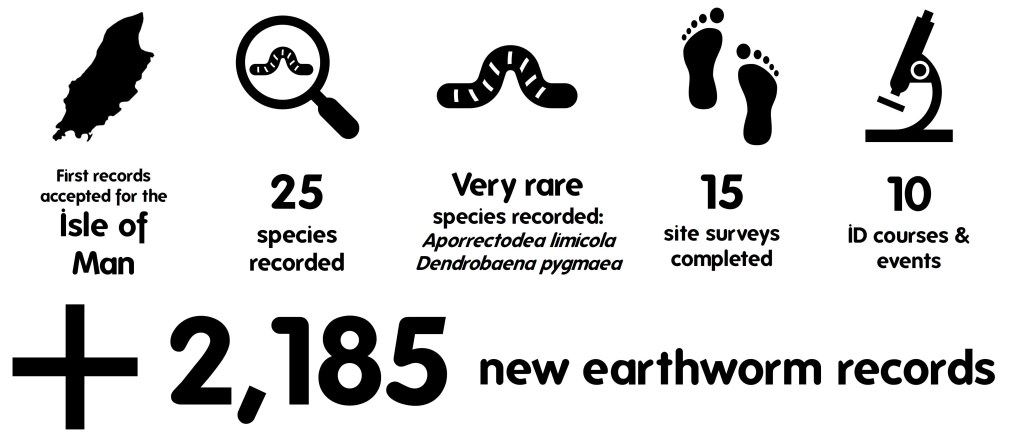
2022 has been a great year for earthworm recording, with 2,185 new earthworm species occurrence records generated! 25 out of the 31 species known to occur in natural environments in the British Isles were recorded, including our first-ever earthworm species records for the Isle of Man.
Alongside new and existing earthworm recorders, I’ve been involved in 15 site surveys across England and delivered 10 earthworm identification courses and events. I’ve also delivered free ‘Introduction to Recording Earthworms’ webinars for audiences in Scotland, Cheshire and Wiltshire.
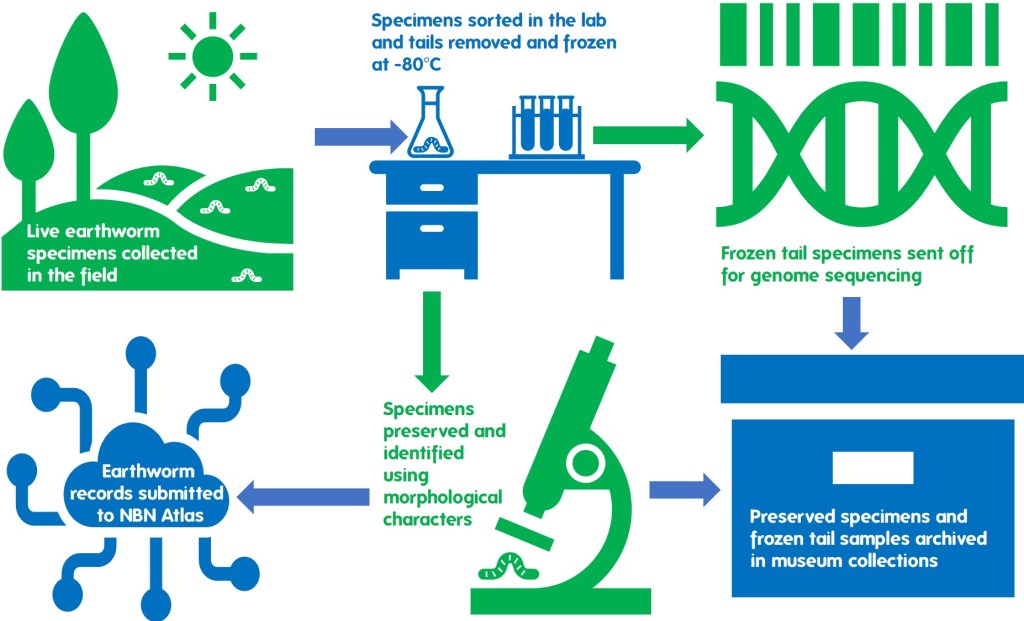
Earthworm Data
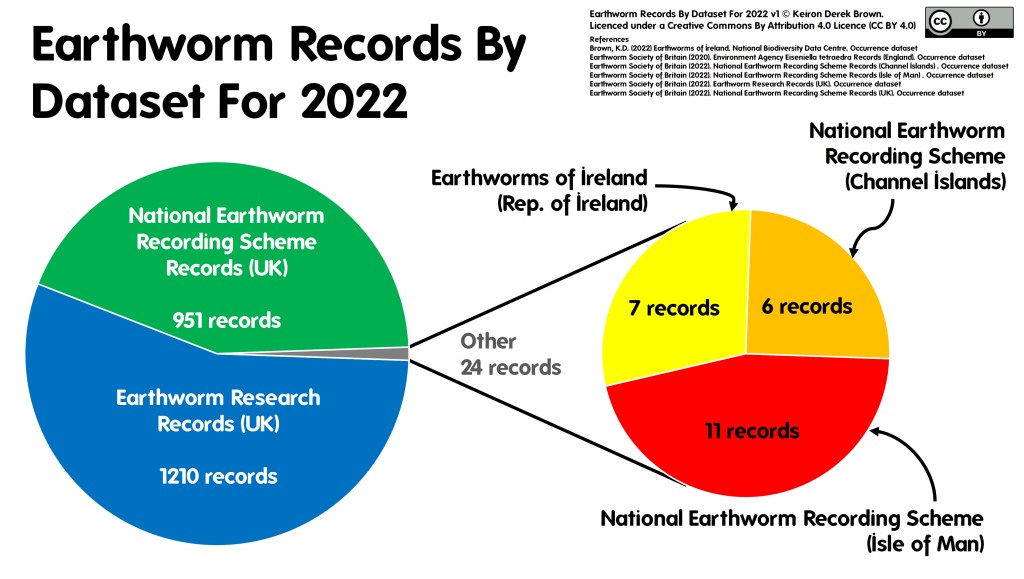
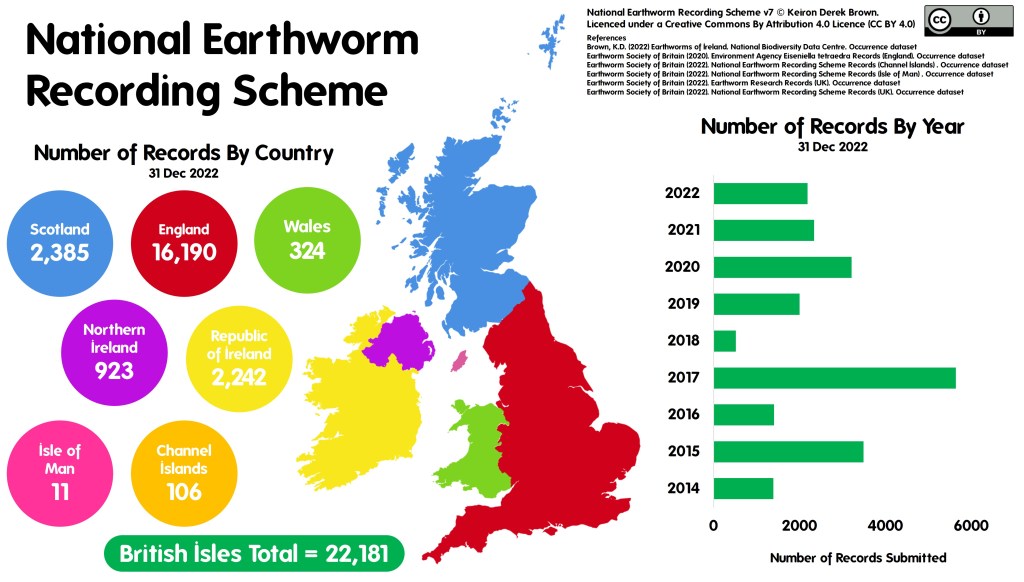
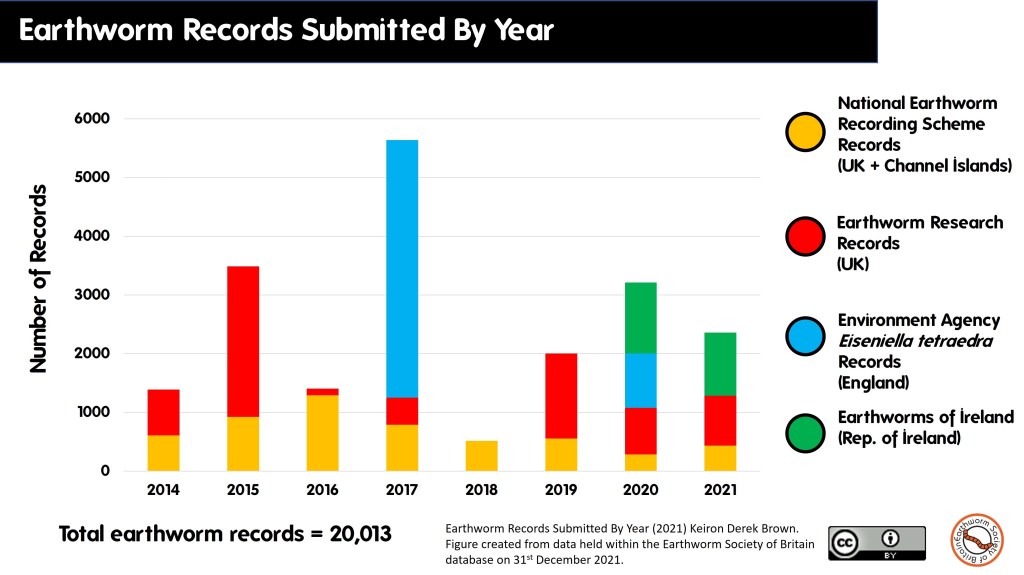
In total, we’ve added 2,185 new earthworm records to the database of earthworm records for the British Isles during 2022. 1,217 of these records were from researchers and 968 resulted from the efforts of earthworm recorders – our second-highest number of earthworm recorder submitted records within a given year since we launched the National Earthworm Recording Scheme in 2014.
England was the most recorded territory, accounting for most of the records received (2,156), with small numbers of records received from Rep. of Ireland (8), Bailiwick of Jersey (6) and Scotland (5). No records were received for Wales during 2022.
This also included the first-ever earthworm records received and verified from the Isle of Man – thanks to Sue Harvey. 8 species of earthworm have now been confirmed for the Isle of Man, with the number due to go up further in 2023 following verification of some specimens sent to the Natural History Museum (London).
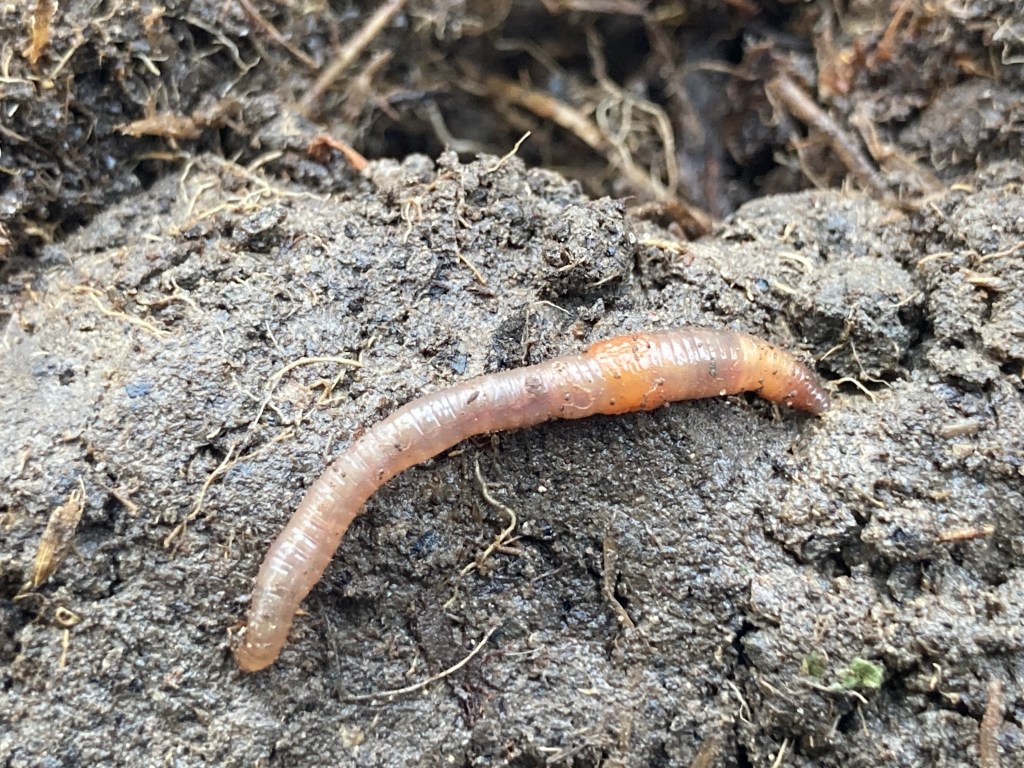
Records were submitted for 25 out of the 31 species of earthworm known to occur in natural environments within the British Isles. Notable records included:
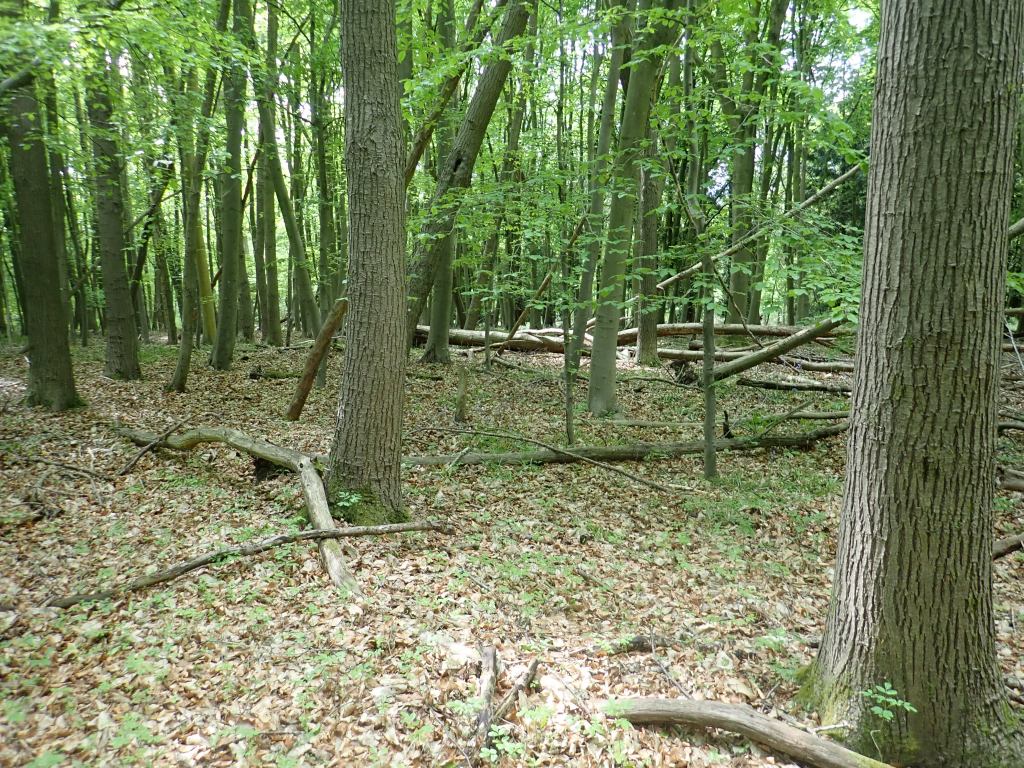
- 3 records of the rare Dendrobaena pygmaea (our smallest earthworm) all recorded from woodland:
- Alice Holt Forest (VC12 North Hampshire) found by Dr Frank Ashwood when searching leaf litter.
- FSC Bishops Wood (VC37 Worcestershire) found my Keiron Brown via mustard sampling on a FSC BioLinks Earthworm Sampling Day.
- FSC Juniper Hall (VC17 Surrey) found by Gino Brignoli’s students on a FSC BioLinks Identifying & Recording Earthworms residential course.
- 4 records of the rare Aporrectodea limicola all recorded from the soil at FSC Bishops Wood in VC37 Worcestershire (2 records by Keiron Brown in February 2022 and 2 records by Kat Galbraith in March 2022).
Courses & Events
2022 was the final year of the FSC BioLinks project and included a record number of earthworm courses and events (19 in total). We held ID courses and earthworm sampling days in London, Surrey, Worcestershire and Shropshire, including our work at Tolworth Court Farm detailed below. In addition, I also co-taught the online Discovering Earthworms course to a whopping 195 students!
I also delivered earthworm training courses and events for a number of other biological recording projects and had the pleasure of training lots of new earthworm recorders. In the North West of England, we sampled Chester Zoo Nature Reserve and taught an ID course at The World Museum with the Tanyptera Project, in Herefordshire we sampled some Wildlife Trust reserves with the Hidden Herefordshire project and in Wiltshire we sampled more Wildlife Trust reserves with the Action For Insects project.
I’m excited to announce that I’ll be working with the Hidden Herefordshire project again in 2023 to deliver more training and hosting more Earthworm Sampling Days in Wiltshire and London (including returning to Tolworth Court Farm), with Yorkshire and Lancashire courses and events in the pipeline!
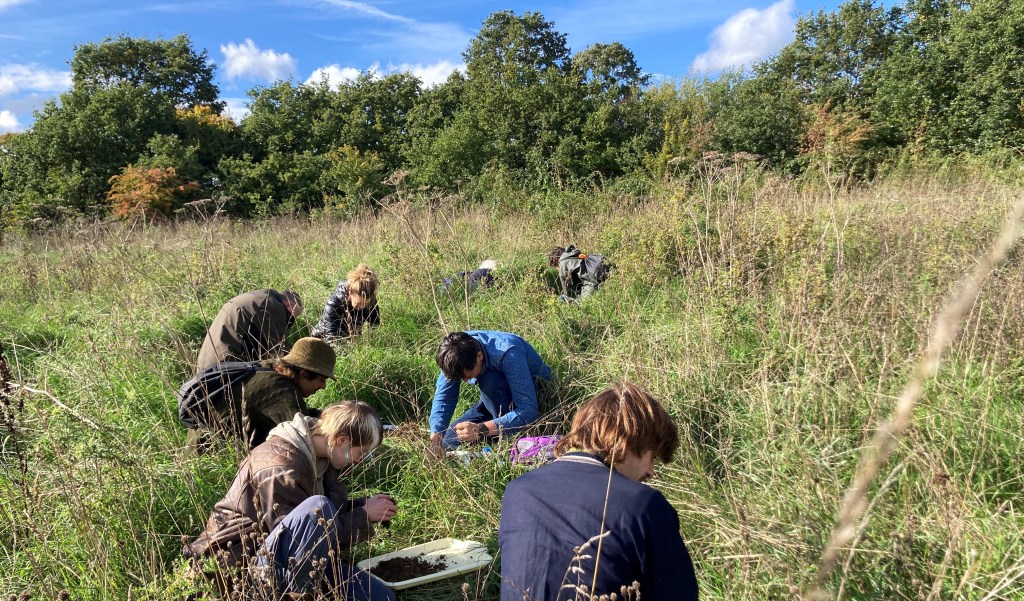
Case Study: Tolworth Court Farm
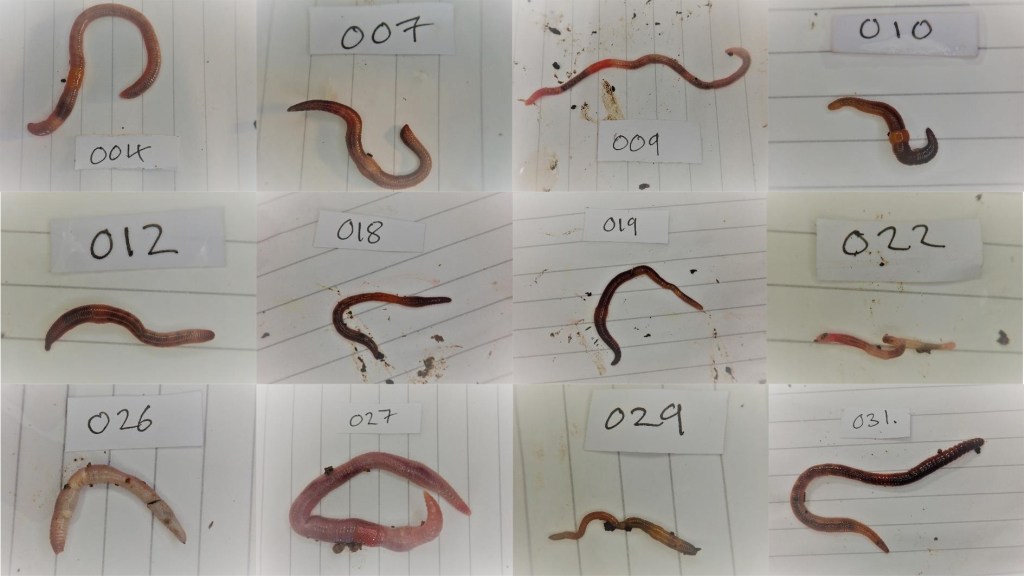
During 2022, earthworms featured heavily in the Wild Tolworth rewilding project by Citizen Zoo. Four Earthworm Sampling Days were held across the two South West London sites that make up the reserve: Tolworth Court Farm Fields and Tolworth Court Farm Moated Manor. These formed part of a workstream to undertake comprehensive ecological surveying of the site ahead of the rewilding of the site.
In total, we generated 99 earthworm species occurrence records and recorded 14 of the 29 species of earthworm known to occur in Great Britain. One additional record is with the Natural History Museum (London) as 6 specimens were found that didn’t look like any of the species that have previously been recorded in Great Britain… watch this space for an update!
See the full Earthworm Site Species Lists for these sites on the Earthworm Society of Britain website:
Summary & Looking Forward To 2023
The Earthworm Society of Britain now covers all territories within the British Isles (though we’re yet to receive any records for Guernsey, Alderney & Sark), with the total number of accepted earthworm species occurrence records rising to 22,181 at the end of 2022.
I’m not aware of any earthworm datasets of a similar size and quality anywhere else in the world so 2023 will be all about putting this data to use. I’m interested in using the data to better understand individual species – specifically their ecology, habitat/microhabitat preferences and rarity (so that their conservation status can be assessed). I’m excited to be working with fantastic earthworm researchers, such as Emma Sherlock and Dr Frank Ashwood, to analyse the data and publish our findings. I’m also delighted to announce that Natural England has commissioned me to publish a provisional conservation status assessment for UK earthworms in early 2023.
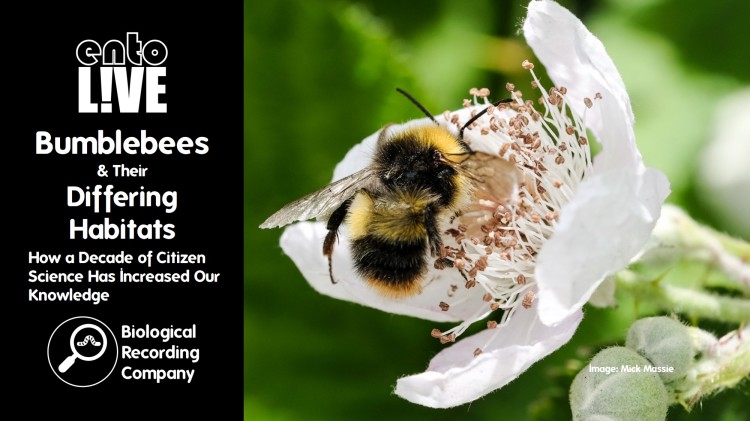
I’ll discuss how I plan to use the earthworm data to improve our understanding of earthworms in an entoLIVE webinar on 02 Feb 2023. The webinar is free to attend but booking is required.
More on earthworms

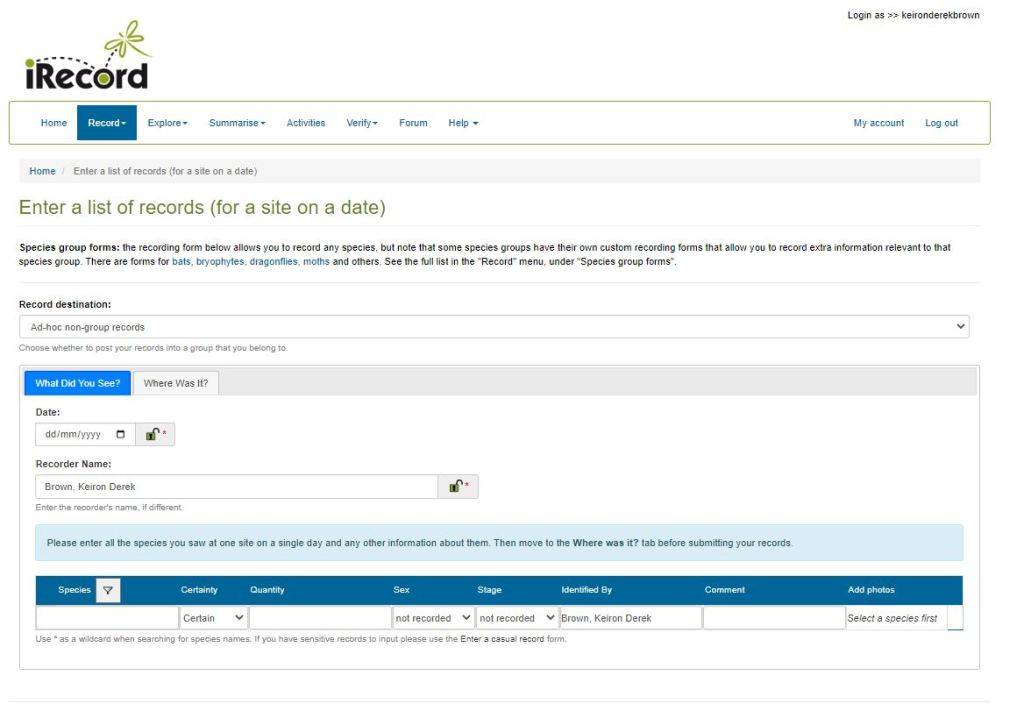


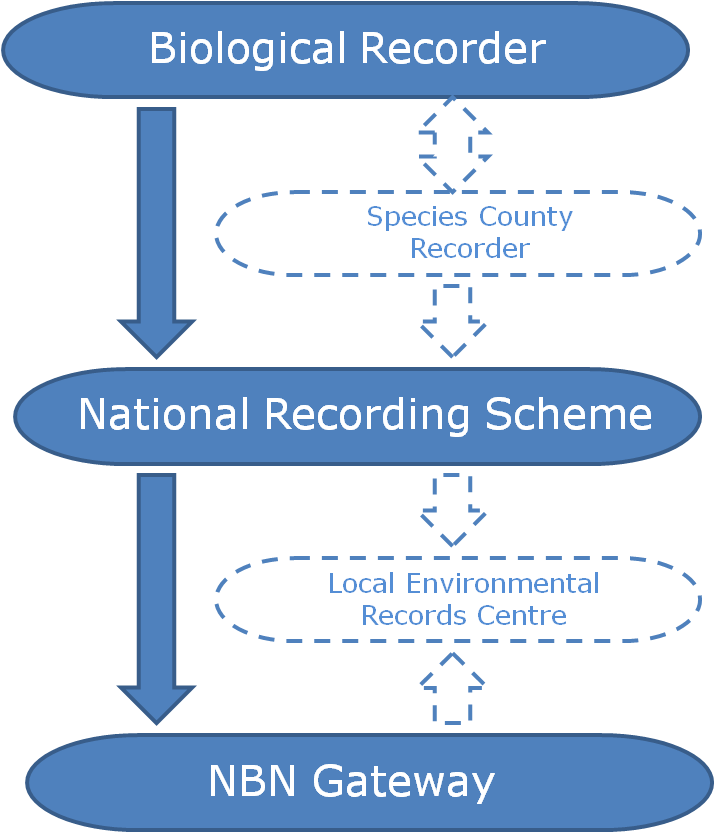
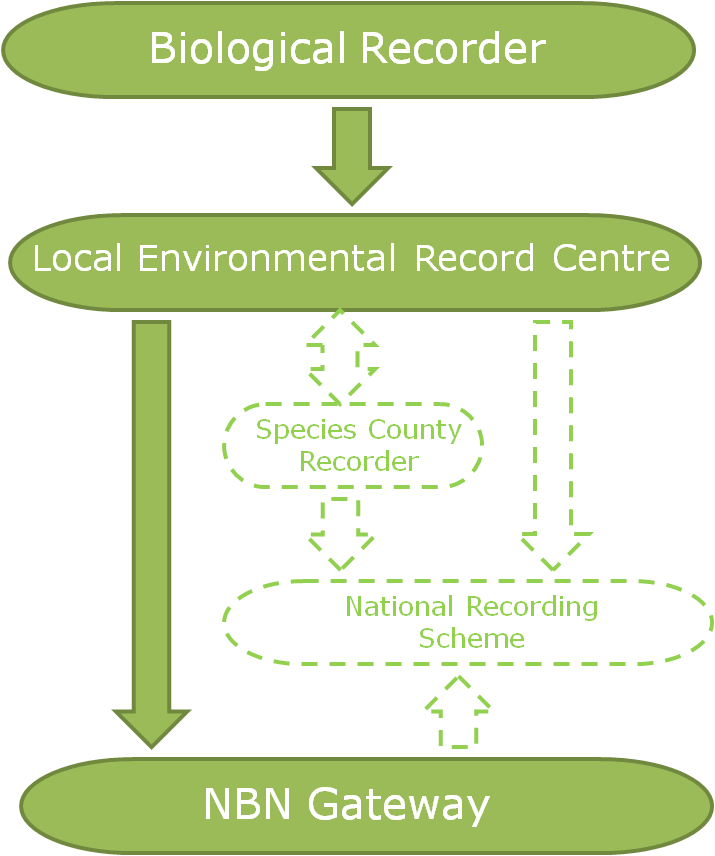 f you would like the record to be considered when decisions are made regarding the area the record was made in, you should submit your record to the
 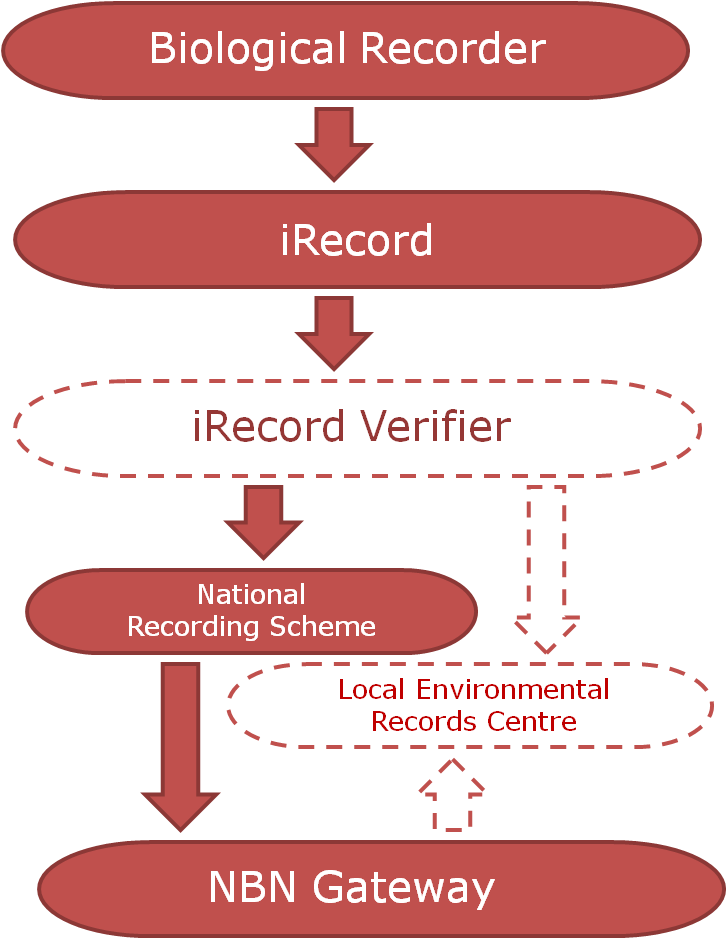 The two routes above consider the use of the record and there are valid arguments for both routes. So why not send all of your records to both the relevant NRS and the LERC? Well, ideally that’s the best option but it’s not always pragmatic for a biological recorder to be able to do this due to the amount of administration that would entail. In fact, even just sending your records to several different LERCs or NRSs can be an administration mountain!
 National Biodiversity Network (NBN)
 National Forum for Biological Recording (NFBR)
 Field Studies Council (FSC)
 Who
Who