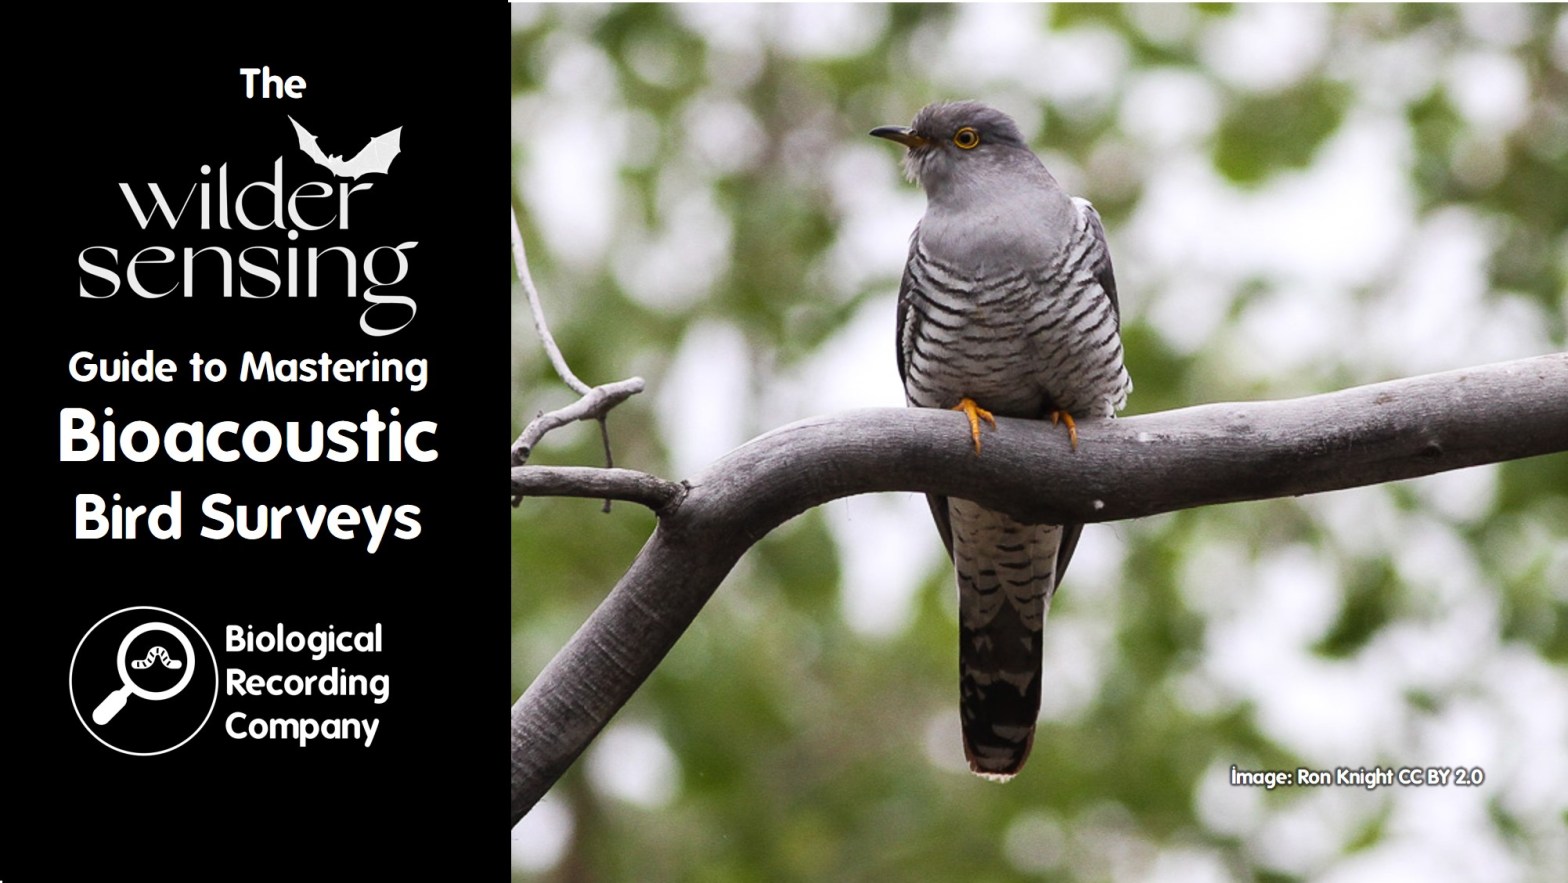
Learn how to effectively plan and conduct bird surveys using bioacoustic methods, utilising sound recorders and cutting-edge AI tools for data analysis and interpretation.
Bioacoustics is revolutionising bird monitoring, offering a non-invasive method to record bird activity continuously, even over extended periods, and generating valuable species occurrence, richness and distribution data.
In this blog, you’ll learn how bioacoustics can reveal critical insights, such as tracking when species arrive at and depart from a site, as well as behavioural patterns through different call types. The presentations will provide practical guidance on setting up sound recorders, tailoring your survey design based on the size of your site and survey objectives, and harnessing the power of AI to process and analyse large volumes of sound data.
Key topics include:
- Setting up and managing passive audio recorders for bioacoustics surveys
- Designing surveys that fit your needs, budget and site characteristics
- Interpreting AI-processed sound data to uncover species behaviour, distribution and richness
Bioacoustics Recorders 101
Paul Howden-Leach (Wildlife Acoustics)
Bioacoustics recorders are a cost-effective and reliable solution for the periodic, seasonal, or ongoing long-term acoustic monitoring of birds and other wildlife in any field conditions. Understanding how the device settings and the best place to position it can make all the difference to what wildlife is captured, and what is missed. In this presentation, Wildlife Acoustics share some of their top tips for getting the most out of your recorder.
Designing Bioacoustics Surveys
Geoff Carss (Wilder Sensing)
Designing a bioacoustics survey involves several key considerations, including defining your monitoring objectives, understanding the habitat types or changes you aim to study, selecting appropriate control locations, and addressing practical factors like site access and health and safety. This presentation delves into these aspects, providing guidance to help you create an effective survey tailored to your needs.
Understanding and Interpreting Your Bioacoustics Data
Cat Scutts (Wilder Sensing)
Bioacoustic surveys can produce millions of species-level records during long-term monitoring, offering opportunities to explore new questions and gain deeper insights into biodiversity. But how do you design an effective survey? How does this align with traditional survey methods? What stories is the data telling us about the biodiversity recorded on site? This presentation and demo demonstrate strategies for designing surveys and interpreting bioacoustic data to maximise its potential.
Useful links
- Song Meter Micro 2: www.nhbs.com/song-meter-micro-2
- Wildlife Acoustics: https://www.wildlifeacoustics.com/
- Wilder Sensing: https://wildersensing.com/
- Contact Wilder Sensing: https://wildersensing.com/contact/
- Wildlife Acoustics grant programme: https://www.wildlifeacoustics.com/grant-program
- How Can We Use Sound to Measure Biodiversity? blog: https://biologicalrecording.co.uk/2024/07/09/bioacoustics-1/
- Can Passive Acoustic Monitoring of Birds Replace Site Surveys? blog: https://biologicalrecording.co.uk/2024/09/17/bioacoustics-2/
- Bird Survey & Assessment Steering Group (2024) Bird Survey Guidelines for assessing ecological impacts: https://birdsurveyguidelines.org
- Abrahams et al (2023) Good practice guidelines for long-term ecoacoustic monitoring in the UK: https://www.researchgate.net/publication/368683386_Good_practice_guidelines_for_long-term_ecoacoustic_monitoring_in_the_UK
- Springwatch 2024 Episode 11 (featuring acoustic monitoring): https://www.bbc.co.uk/iplayer/episode/m00205c3/springwatch-2024-episode-11
- CIEEM Guide to Ecological Surveys and Their Purpose: https://cieem.net/wp-content/uploads/2019/02/Guide-to-Ecological-Surveys-and-Their-Purpose-Dec2017.pdf
- IOA Guidelines for acoustic monitoring: https://www.ioa.org.uk/news/guidelines-uk-eco-acoustic-monitoring

What evidence base have you used to set detection confidence at 0.85 and location probability at 0.1?
Cat: At the moment there isn’t an evidence base. It’s through use and inspection that we’ve come to those levels. What species or metric you’re looking at will really influence the settings you use. For instance, if you want a really solid baseline that you don’t have to go away and validate, then put the confidence up very high (i.e. 0.9 or 0.95). That will likely remove species that are present too, but it’s a balance between your time and the resources that you have [available for validation].
The location probability is based on eBird data. We are looking at refining and changing it so that it doesn’t cut out so many of the under-reported species. Again, 0.1 is a rule of thumb for what seemed to make the most sense when looking through species lists. Looking at your species list is a really good starting point to asking validation questions. Are these the species that you’d expect to see at this location? Does this match with any seasonal surveys previously undertaken? Are there any unexpected species?
Geoff: We‘ve started thinking about species-specific thresholding, to try to get the balance a bit more. For example, some birds vocalise more than others and they have different ranges. This gets into some quite serious research [which is] outside of the scope of our work at Wilder Sensing. [But] there are PhD students and post docs looking at this. When evidenced we can adopt [the results of] some of this research and bring it into the platform.
Can bioacoustics data be linked to functional diversity of sites?
Functional diversity is the diversity of [species fulfilling] different ecological functions on sites, i.e., different traits and different roles in the ecosystem.
Cat: Our tool allows you to look at assemblages from your species list and [investigate] what [the community] tells you about the habitat and the site. If you have different sets of species [present] that represent those different niches and habitat types, [you can infer results related to functional diversity]. What I didn’t show in my presentation is that when you choose individual species to view them in the dashboard, you can choose more than one. If you’ve got a set of ground feeders, or wading birds [for example] that you want to look at, you can [select and view them] together [to investigate the results]; and maybe contrast with other functionalities as well.
Geoff: Work by Ecosulis and CreditNature is probably more advanced in relation to this than what we’re doing at Wilder Sensing. Our focus is [on facilitating] monitoring species assemblages over time. Based on research that I’ve looked at, the bird assemblage is more sensitive as an indicator of change than the plant assemblage.
Is the Wilder Sensing subscription package flexible?
Geoff: Absolutely. We recognise that people have very different requirements, from doing annual or multi-year surveys through to a two- or three-week survey, and we support all of these different use cases. Just contact us via info@wildersensing.com or our website contact form and we can have a discussion on what’s right for you.
Is there a good method for using bioacoustics for wider baseline monitoring such as assessing a habitat creation scheme?
Geoff: We’ve only been doing this 2-2.5 years, so we’ve only got a limited amount of data to date. I think there’s a really good argument for creating habitat indices, to help us understand aspects such as how habitat changes over time as it moves from grassland to scrub, how a site is developing over that time, and how it compares to other sites. Is your assemblage changing in line with other interventions that might be similar? What can you identify as ‘good’ practice – ‘good’ is a very loaded word in that context – so what’s a better practice than others, if you’re trying to achieve an outcome of species richness or target species recovery, etc?
For long-term surveys of 30+ years, then there are a few factors to consider. One is making sure your recordings are really good quality because in 20 to 30 years’ time, who knows how technology will have advanced? Make sure your recordings are well backed up and protected. Anyone using our platform will have their recordings archived into deep storage so we don’t lose them. Then in five to ten years, [when] there are better models and algorithms, we can go back and reprocess all [of] that data [if requested]. Control as many of the variables as you can: use the same recorders over a long period of time and make sure they are maintained. You’re trying to remove the variability from the recorders themselves. That can be really important.
Cat: Looking at the overall scope and scale of your survey will inform the resolution that you need to sample at. You might want to survey on a rotation, depending on the overall length of your project and the size of your site. For example, surveying every 5 years if your [project] period is 30-40 years. If it’s a ten-year project over a really vast area, then you might move those recorders on a two- or three-yearly basis. It will depend on your resources and the number of recorders that you have available, as well as the number of people you have to sort out battery and SD card [changes]. So, looking at the overall scope and scale [of your project will indicate] the kind of resolution that you want to be sampling.
Is there a list of species that can’t be differentiated, such as the hawfinch and robin?
Geoff: There are, and it’s not just birds. I’ve heard a recording of a Mole Cricket that I could have sworn was a Nightjar!
We are building up a list of confusion species and working on fixing these issues. For example, we started picking a lot of Short-toed Tree Creepers. Tree creepers are not the easiest to spot at the best of times, are very rare and I’ve never found one when ringing. One of the volunteers then suggested that the confusion was with a Dunnock!
The tool [analyses for detections in] three second sound clips so we can also look at the pattern that is being registered. For example, if we’ve picked up a single Hawfinch call, and we look at the species detection tags registered before and after the call we can make assumptions based on this. If the data states ‘Robin, Robin, Robin, Robin, Robin, Hawfinch, Robin, Robin, Robin, Robin, Robin’, it is most likely that the Hawfinch-tagged call is actually a Robin.
We are looking at ways of solving these issues, but it should be noted that not all fixes will come from machine learning.
Wilder Sensing ecoTECH blogs
- How Can We Use Sound to Measure Biodiversity: https://biologicalrecording.co.uk/2024/07/09/bioacoustics-1/
- Can Passive Acoustic Monitoring of Birds Replace Site Surveys blog: https://biologicalrecording.co.uk/2024/09/17/bioacoustics-2/
- The Wilder Sensing Guide to Mastering Bioacoustic Bird Surveys: https://biologicalrecording.co.uk/2024/11/26/bioacoustics-3/
- Bioacoustics for Regenerative Agriculture: https://biologicalrecording.co.uk/2025/03/31/bioacoustics-for-regen-ag/
- AI-powered Bioacoustics with BirdNET: https://biologicalrecording.co.uk/2025/07/08/birdnet/
- Making the Most of Bird Sounds: https://biologicalrecording.co.uk/2026/03/11/making-the-most-of-bird-sounds/
Event partners
This blog was produced by the Biological Recording Company in partnership with Wilder Sensing, Wildlife Acoustics and NHBS.
- Sign up for the Wilder Sensing e-newsletter: https://2e428x.share-eu1.hsforms.com/2XxP8d_6lRSmBIKH7uwruXQ
- Wildlife Acoustics Song Meter Micro 2: www.nhbs.com/song-meter-micro-2
- Wildlife Acoustics Song Meter SM5: https://www.nhbs.com/song-meter-sm5-acoustic-recorder
- Check out the NHBS Field Guide Sale: www.nhbs.com/spring-promotions
More for environmental professionals


One thought on “The Wilder Sensing Guide to Mastering Bioacoustic Bird Surveys”