The water quality of our rivers, lakes and seas is a hot topic, with water companies under fire for the amount of raw sewage being discharged into British waters. The impacts of this can be devastating for our wildlife and can impact food supplies, human health and tourism.
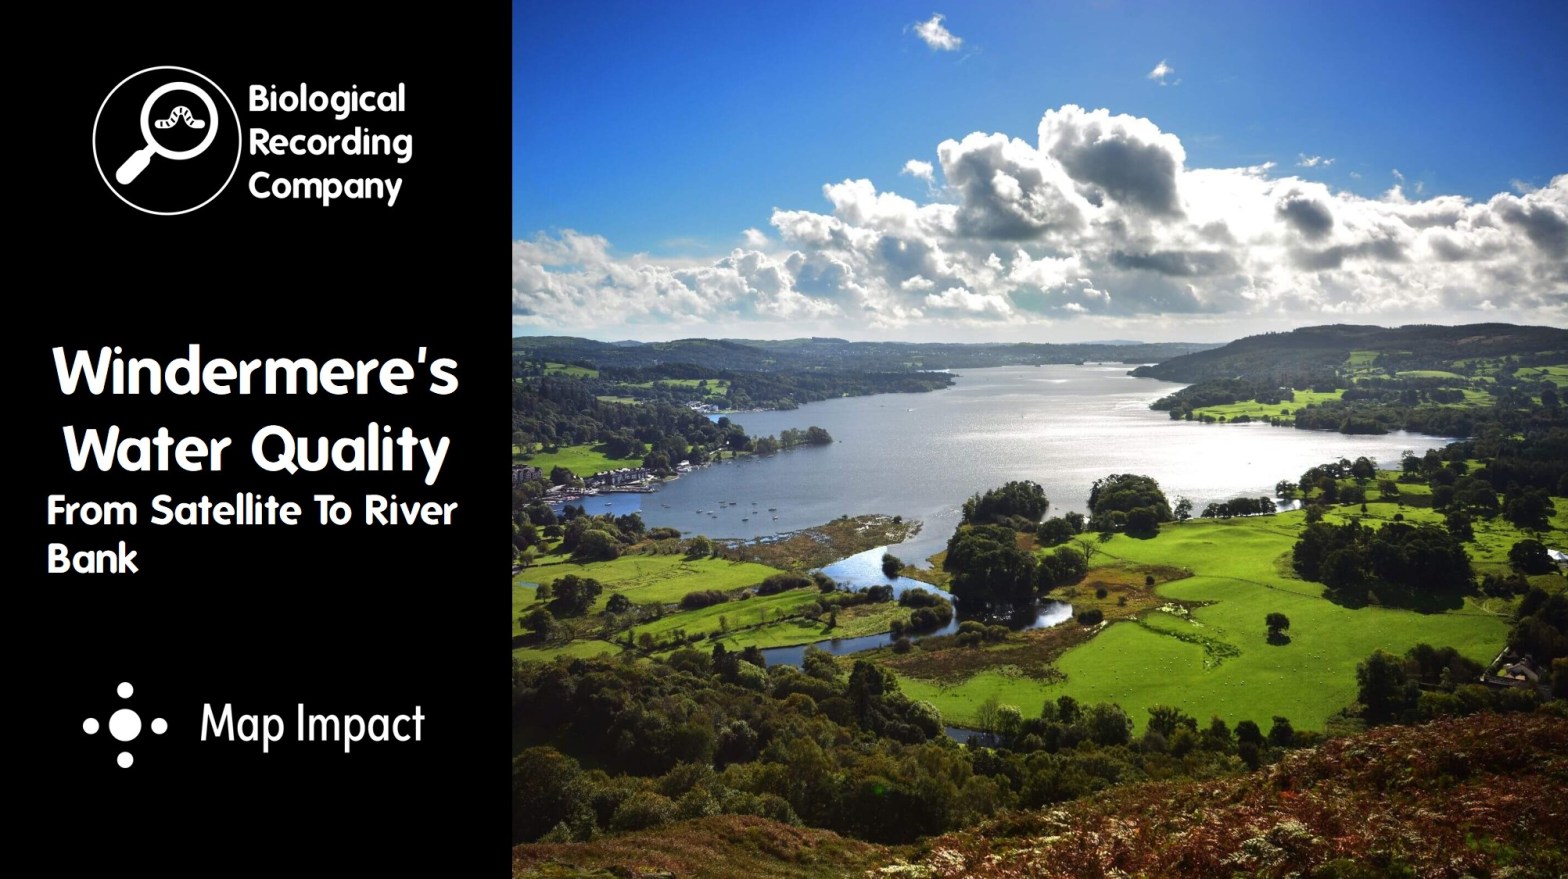
Lake Windermere is located in the heart of the Lake District and is also England’s largest lake (by area, length and depth). It supports a diverse range of wildlife and is pivotal for the tourism sector that supports the region economically. It was also central to ‘The Water Pollution Cover-Up’ episode of BBC Panorama due to incidents of high phosphorus levels causing algal blooms that turn the lake green and suffocate the wildlife within its waters.
This blog looks at some of the evidence behind these algal blooms. We’ll explore different sources of data, such as invertebrate monitoring, satellite imagery and human activity data to establish if a common cause can be established. the blog features the following presentations:
- Windermere’s Water Quality: Invertebrate Insights with Dr Sam Green (WildFish)
- The Health of Windermere: A Satellite Perspective with Richard Flemmings (Map Impact)
- Panel discussion facilitated by Matt Staniek (Save Windermere)
Windermere’s Water Quality: Invertebrate Insights
Dr Sam Green (WildFish)
WildFish, in collaboration with Save Windermere, formed a SmartRivers hub in 2023 to begin surveying the freshwater invertebrate populations on the rivers and becks feeding into Lake Windermere. This project aimed to get a clearer picture of the ecological health of the Windermere catchment, and in particular how water company assets could be impacting biodiversity and water quality.
The results from the first year of invertebrate surveys have been published on the WildFish website and monitoring for 2024 is already underway. This presentation provides a greater understanding of the importance of invertebrate monitoring and an overview of our findings so far.
Dr Sam Green is a freshwater ecologist at WildFish primarily supporting the SmartRivers programme. WildFish is the only independent charity in the UK campaigning for wild fish and their habitats. We identify and lobby against the key threats driving the decline in wild fish populations, from various forms of pollution to open-net salmon farming. Ultimately, our goal is for fresh and coastal water habitats that are clean, healthy, biodiverse, and able to support sustainable populations of wild fish.
Q&A with Dr Sam Green
- Is Smart Rivers connected with the Riverfly Partnership, to ensure effective collaboration?
Yes. SmartRivers is one of the Riverfly Partnership’s Riverfly Plus schemes. The two schemes complement each other in terms of monitoring rivers, but ARMI data and SmartRivers data do different things. The acute issues monthly bankside monitoring sampling is designed to pick up pollution events and uses family-level identification. SmartRivers uses species-level identification with monthly monitoring and twice-annually deep dives into the chronic pressures on rivers. - Do you find a higher abundance of tolerant species in polluted waters or a lack of sensitive species (such as mayflies)?
We look for shifts in the entire invertebrate community as often when you lose pollution-sensitive species, more tolerant species can exploit this vacated niche and increase in numbers. Certainly, in our Windermere data we’ve seen examples of higher numbers of pollution-tolerant species at downstream sites like the New Zealand Mud Snail and other pollution-tolerant molluscs and true flies. - Why is data not collected during the summer season?
The SmartRivers sampling protocol only involves collecting two seasons of data: spring and autumn. It would be great to have data from year-round sampling but capacity makes that unrealistic, both due to the fact that the sampling is volunteer-led and that WildFish is a relatively small conservation charity. - How are the sediment and phosphorus pressure scores derived?
The scores are calculated using methodologies that have been peer-reviewed and use the information on the invertebrate communities recorded, i.e. the presence and absence of specific organisms and the numbers that are recorded within a sample. This is calculated using mixed-level taxonomic data for the sediment pressure score (PSI – the Proportion of Sediment-sensitive Invertebrates index) and family-level data for the phosphorus pressure score (TRPI – Total Reactive Phosphorus Index). - What are the main chemicals impacting the sites?
The SPEAR biometric indicates the presence of chemical stress on invertebrates, but unfortunately not what chemicals are impacting the sites. SPEAR values indicating chemical stress can be the first step in longer-term projects aiming to identify the chemicals causing problems in our rivers. For example, teh scores could be used to locate sites for more resource-intensive monitoring methods such as chemcatchers. - Is it possible to have free access to your open-source database?
Yes. Email smartrivers@wildfish.org to obtain free access to the dataset.
Further info
- SmartRivers entoLIVE blog: https://biologicalrecording.co.uk/2023/12/04/smartrivers/
- WildFish website: https://wildfish.org/
- SmartRivers webpage: https://wildfish.org/project/smart-rivers/
- WildFish (2023) SmartRivers: Our Progess to Date: https://wildfish.org/wp-content/uploads/2023/03/SmartRivers-Progress-Update-2023.pdf
- WildFish (2023) SmartRivers: What your data told us in 2022: https://wildfish.org/wp-content/uploads/2023/11/2022-SmartRivers-data-update_271123.pdf
- WildFish (2021) Riverfly Census Revisited: A National Emergency: https://wildfish.org/wp-content/uploads/2022/07/2021-Riverfly-Census_200722.pdf
- WildFish respond to United Utilities questioning of SmartRivers report: https://wildfish.org/blog/wildfish-respond-to-united-utilities-questioning-of-smartrivers-report/
- WildFish SmartRivers Windermere Data Report: https://wildfish.org/wp-content/uploads/2024/02/140224_SmartRivers-data-report_-Windermere.pdf
The Health of Windermere: A Satellite Perspective
Richard Flemmings (Map Impact)
To bring further understanding to the growing environmental issues at Lake Windermere, Map Impact, in collaboration with various stakeholders, embarked on a project aimed at introducing fresh perspectives and novel data sources to the study of the lake’s ecosystem. This effort received backing from the UK Space Agency under the Climate Services funding initiative. The project, which ran for six months, concentrated on combining satellite technology, human movement data, and climate data to provide further understanding of the influences and factors affecting lake nutrient content.
The results of the project have been openly published within a comprehensive report that includes methods, confidence and limitations. This is being used across the community to support understanding of the key factors affecting water health and inform mitigation activities that counteract pollution.
Attendees will be provided with an understanding of:
- The advantages and limitations of satellites as an important information source.
- How satellite information has been correlated with various other data sources to show trends and new information about the state of the Lake.
- How this data can be applied to support the future protection of the Lake and wider catchment area.
Richard Flemmings has specialised in applying geospatial and satellite earth observation data to environmental challenges throughout his career. He is interested in taking a highly collaborative approach to ensure that these data feeds can benefit as much of society as possible.
Q&A with Richard Flemmings
- How could visitor numbers be responsible for algal bloom events?
Visitor numbers put a strain on the wastewater infrastructure, potentially leading to increased nutrient input if not treated properly. - What software do you use to interpret the satellite data?
We mainly used Google Earth Engine and Python for interpreting satellite data. - How do you exclude other factors such as weather when assessing the correlation between visitor numbers and algal blooms?
The approach that we’ve taken is to look for correlations between peaks and troughs in chlorophyll content with peaks and troughs in temperature and other weather events. There are times when we can’t exclude these potential factors because visitor numbers and temperature/weather are often linked. However, through statistical analysis we have shown that there are situations where the weather does not appear to be the influencing factor and human movement is. - Is there scope for improvement of water quality monitoring with the use of real-time monitoring devices and sensors?
Absolutely/ We’ve taken landscape and remote perspective using open-source specific-point data to train our model. I think there is huge potential for adding in other aspects, such as in-situ sensors that measure the level of chlorophyll at set points within the lake and feed this data into the model. Combining these technologies opens up huge opportunities.
Further info
- Windermere Catchment Analysis: https://www.mapimpact.io/project/windermere-catchment-analysis/
- The Health of Windermere: A Satellite Perspective (summary document): https://www.mapimpact.io/wp-content/uploads/2024/03/Map-Impact-%E2%80%93-Health-of-Windermere-%E2%80%93-Summary.pdf
- Download the Windermere Catchment Analysis technical summary: https://www.mapimpact.io/windermere-catchment-technical-study-download/
- Map Impact’s BiodiversityView: https://www.mapimpact.io/product/biodiversityview/
- UK Space Agency Climate Services projects: https://www.gov.uk/government/news/water-pollution-carbon-emissions-and-biodiversity-threats-set-to-be-tackled-by-satellite-data-services
Panel Discussion
Hosted by Matt Staniek (Save Windermere)
Matt Staniek grew up in Windermere and studied Zoology at university, before returning home. Matt was appalled when he found out that sewage is being discharged into our lake and at that moment, decided to dedicate his life to solving this issue. Save Windermere has grown into a registered not-for-profit Community Interest Company (CIC), governed by a Board of Directors. We are all based locally in Windermere and care deeply about our wildlife, our community and our lake.
- Are there other organisations monitoring the same or other aspects of Windermere and how does their data fit with yours?
Richard: One of the things covered in the project technical report is how we compared our data to the Big Windermere Survey data, and how it helped us reach the conclusion that we did. We also used some of the openly available EA data. All of these datasets should be open access so it is easy to use them alongside one another. There are a lot of people and organisations working within this space and this was a relatively short project, which limited how much some stakeholders were able to collaborate. - Are there plans to introduce methodologies to identify and test for the chemicals that are polluting water courseways?
Sam: The SmartRivers methodology uses a metric called SPEAR to assess if there is chemical pressure, but it can’t tell you what chemicals are causing issues. However, SmartRivers does help us figure out where on the water course it is best to invest resources in further monitoring, such as the use of passive water quality devices like chemcatchers within the river to determine which chemicals are present and at what concentrations. The issue is that this can be expensive to undertake and as a small conservation charity we would require collaboration with bigger agencies that have the resources and capacity to undertake such monitoring. - What can individuals do on a national scale to improve water quality in our rivers, lakes and seas?
Sam: We do need to hold water companies to account, but we are also responsible for own personal behaviour. Everyone can make small changes, such as considering the impact of letting our dogs swim in rivers and lakes when we’ve used spot-on flea treatments that a specifically designed to nuke invertebrates. If people want to go further, getting involved with citizen science projects (such as SmartRivers) is a great way to contribute towards cleaner water.
Richard: Personally I am involved with Surfers Against Sewage as a surfer who is regularly in the sea. Even if you are not able to get involved with a campaign group such as Save Windermere or Surfers Against Sewage, take the time to follow what they are reporting on to stay engaged and ensure that awareness of these issues is maintained. - Are there any mitigation actions being taken within this catchment as a result of these results?
Richard: By making the results from the satellite project
openly available, our aim is to provide objective evidence to justify and
support mitigation activities. This includes improving general awareness of
algal blooms in the lake and providing the appropriate justification for
reducing these over time. We also see a lot of discussion relating to nature
based solutions to improve water quality (for example, in support of improving
riparian edges) and satellite data has huge potential to support targeted
intervention and monitoring to show that changes in water quality are happening.
Sam: The data generated from SmartRivers monitoring is only the start of our monitoring programme. We’ve already collected data for Spring 2024 and will continue doing so in the years to come. Once we have a few years of data we can begin to really investigate the trends we are seeing in the catchment and use the data to lobby for change. Our data is open access for anyone to use. We’ve had feedback from United Utilities, some of which helpful and some not (see our blog), and I know Matt is in discussion with the local Environment Agency. So hopefully in the future we will be able to constructively work with them and use the data as we have with the agency in other parts of the country.
Event Partners
This webinar will be delivered by the Biological Recording Company in partnership with Map Impact.
More for environmental professionals